Icinga – Network Monitoring Software Free Download For Windows
Icinga is an open-source scalable and extensible network monitoring system that checks the availability of your network resources notifies users of outages and generates performance data for reporting.
This software can monitor large, complex environments across multiple locations. It displays the issues with hosts or services in a unified view and notifies during outages.
It is attempting to get past perceived short-comings in Nagios’ development process, as well as adding new features such as a modern Web 2.0 style user interface, additional database connectors (for MySQL, Oracle, and PostgreSQL), and a REST API that lets administrators integrate numerous extensions without complicated modification of the Icinga core.

Icinga Features
Efficient Monitoring Engine
Across your entire infrastructure, Icinga gives you the power to watch any host and application. The monitoring engine is capable of monitoring the entire data center and clouds. Collected results are processed and stored in a resource-efficient way.
Appealing Web UI
A fast and well-organized web interface gives you access to all relevant data. Custom views are build by grouping and filtering individual elements and combine them in custom dashboards. The appealing web interface lets you take action in just one click, enabling you to react to any event.
Safe and Secure
Every single connection of this software is secured with SSL, securing your sensitive data through the whole network. Users can be restricted to view and edit only certain parts in your monitoring system.
Get Notified Immediately
Having knowledge is the first step when solving incidents. It gives you that knowledge at any time you wish, through any channel you want. Alerts pave the way to wholesome incident management and recovery process.
Monitoring opportunities
- Monitoring of network services (SMTP, POP3, https, NNTP, ping, etc…)
- Monitoring of host resources (CPU load, disk usage, etc…)
- Monitoring of server components (switches, routers, temperature and humidity sensors, etc…)
- Simple plug-in design that allows users to easily develop their own service checks
- Parallelized service checks
- Ability to define network host hierarchy using “parent” hosts, allowing detection of and the distinction between hosts that are down and those that are unreachable
- Ability to define event handlers to be run during service or host events for proactive problem resolution.
Visualization & Reporting
- Two optional user interfaces for visualization of host and service status, network maps, reports, logs, etc.
- This software has a reporting module based on open source Jasper Reports for both Classic and Web user interfaces
- Template-based reports (e.g. Top 10 problematic hosts or services, synopsis of complete monitoring environment, availability reports, etc…)
- Report repository with varying access levels and automated report generation and distribution
- Optional extension for SLA reporting that distinguishes between critical events from planned and unplanned downtimes and acknowledgment periods
- Capacity utilization reporting
- Performance graphing via add-ons such as PNP4Nagios, NagiosGrapher, and graph.
Other features
- Rule-based configurations
- REST API
- Icinga director
- Elastic search
- Performance monitoring
- Authentication
- Dashboards
- Generis TTS
- Multiple check plugins
- Text notifications
Icinga Benefits
Monitoring of Services
It is a flexible, open-source monitoring platform that has the capability to cover most of your monitoring requirements due to its customizable framework.
Out of the box, This software is strong at monitoring servers and devices, supporting both direct monitoring and SNMP. It excels at providing data and alerts for availability, connectivity, and general health checks of your infrastructure.
When it comes to net flow, application monitoring, and database monitoring, Icinga 2 is capable but requires custom configuration or additional plugins. The more specific you can be about your intended data points and thresholds, the more success you will have with Icinga 2. If you are hoping to turn Icinga 2 on and receive a flood of monitoring data points, then it is not an ideal tool for you
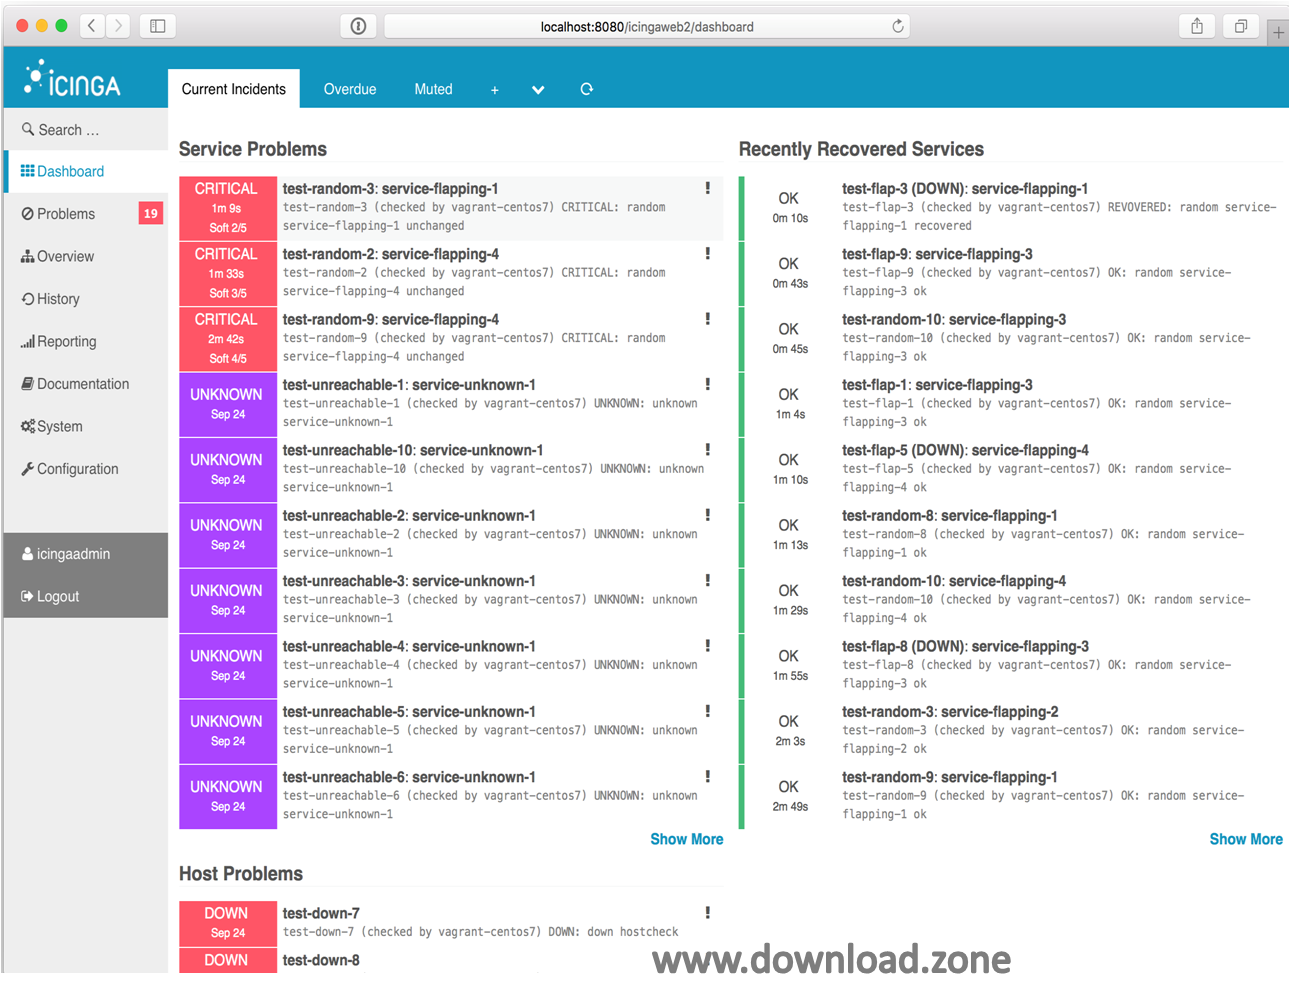
Here’s a screenshot of Icinga’s incident dashboard:

Direct Monitoring vs SNMP
It supports both direct monitoring and SNMP monitoring but it is not your typical SNMP tool. Because it lends itself more to direct monitoring, Icinga 2 can be quickly configured vs an SNMP monitoring tool. On the flip side, if you want to receive all data points for a hardware device, such as a router, you will need to configure it individually for each datapoint vs. an SNMP tool that will provide all data metrics once the tool is set up to monitor the specific device.
Flexibility
It is designed to be object-oriented from top to bottom. It has a rich configuration language that allows the expression of complex configurations in a minimal amount of text, allowing monitoring configurations to be written quickly and concisely. Combined, these two architectural features allow the creation of a large number of monitoring data points in a small amount of time.
Speed
It is built to be fast. It can run thousands of checks every second due to its multithreaded design when most monitoring tools run checks every few minutes. If you need quick notification of a system issue, this is another area where Icinga shines.
Clustering and Zone Monitoring
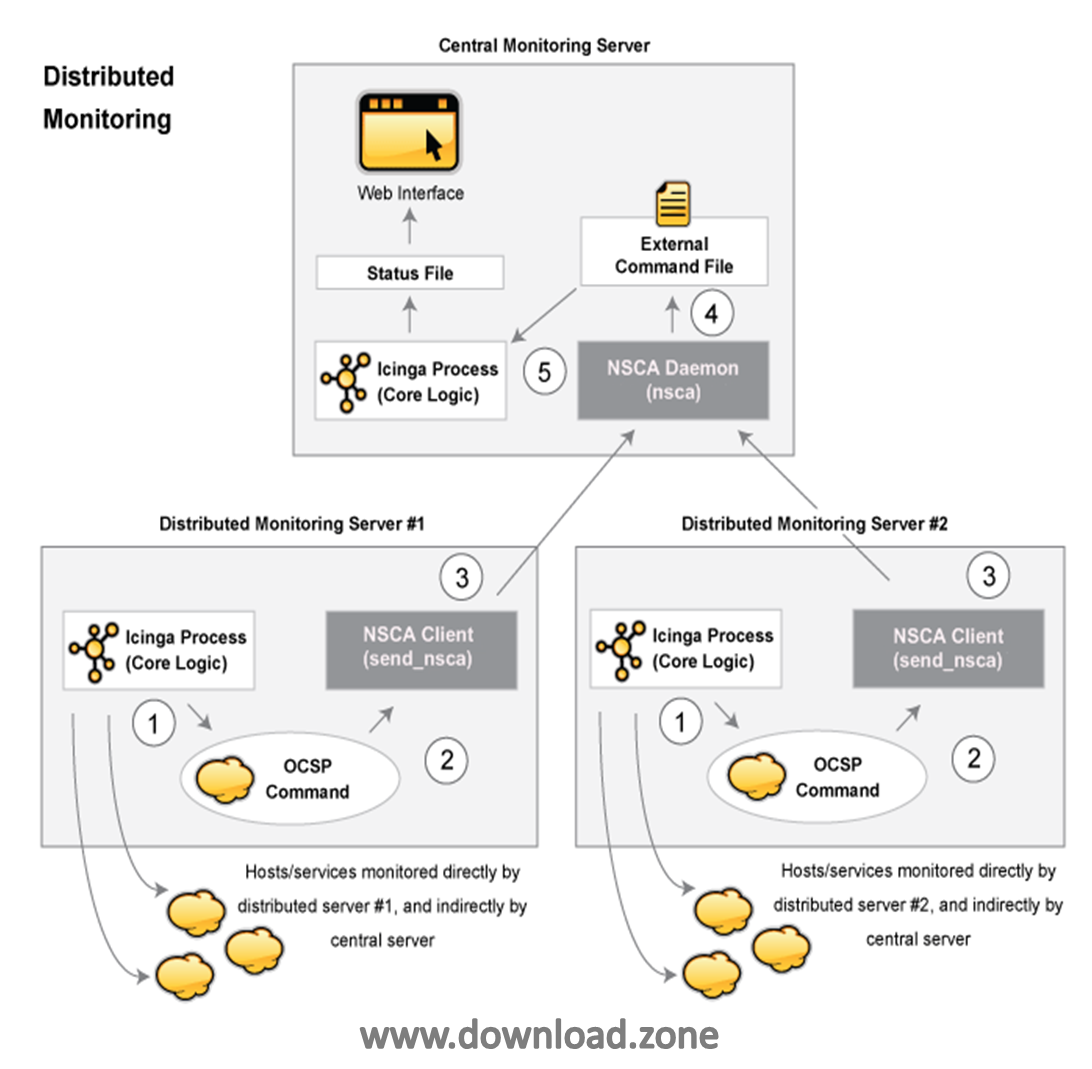
The clustering and zone monitoring abilities of this software yield high availability at several different levels. It allows the architect to create a distributed hierarchy of monitoring systems where checks are run local to regions of the network and only the results are relayed back to the masters. In very large implementations this removes a burden from the masters, freeing resources to spend more time on recording, display, and notification.
It also supports enterprise-level scaling. Satellite nodes can form high availability clusters with load balancing and replication managed by an active zone instance, ensuring that the updated version maintains its own availability to provide monitoring data.

Configuration & Templates
Different from it’s Nagios ancestor, Icinga 2 recently introduced an object-based, rule-driven configuration. The configuration format is similar to Puppet with a clear “one best way” of creating configuration rules, allowing it to remove user confusion that exists with Nagios today.
To help simplify the configuration of multiple hosts, This software supports the use of templates. Templates are used to apply services and notifications to hosts, or downtimes and dependencies to services.
Open Source Community Focused
The reason why this software created a new open-source network monitoring product based on Nagios is that they wanted to be more community-focused and adaptive to the dynamic needs of the IT marketplace.
Although Nagios is a strong player in the monitoring space, It identified several pain points that they wanted to address like the UI, the confusing configuration format and scalability limitations. Another area that software shines as a company is its pattern of frequent innovation and growth, releasing new versions every few months while maintaining compatibility between statistical software and the existing Nagios plugins.

What’s New Version 2.10.5
Bugfixes
-
Core
- Fix crashes with logrotate signals #6737 (thanks Elias Ohm)
- API
-
- Fix crashes and problems with permission filters from recent Namespace introduction #6785 (thanks Elias Ohm) #6874 (backported from 2.11)
- Reduce log spam with locked connections (real fix is the network stack rewrite in 2.11) #6877
-
-
Cluster
- Fix problems with replay log rotation and storage #6932 (thanks Peter Eckel)
-
IDO DB
- Fix that reloads shutdown deactivates hosts and host groups (introduced in 2.9) #7157
-
Documentation
- Improve the REST API chapter: Unix timestamp handling, filters, unify POST requests with filters in the body
- Better layout for the features chapter, specifically metrics, and events
- Split object types into monitoring, runtime, features
- Add technical concepts for cluster messages
Icinga Pros and Cons
| Pros | Cons |
| Free & open source | Doesn’t support every Nagios-specific plugin |
| Employed by big companies such as PuppetLabs, Audi, SnapDeal, Debian | Produce random issues while working with an Apache server |
| Offers three distinct command types, namely Check, Notification and Event Commands | Configuration can be confusing and difficult. For non-Unix people, the learning curve is very intimidating |
| Any additional option can be given priority over the other | It is a monitoring solution only. It doesn’t generate PHB graphs, but everyone seems to expect it to |
| Event handlers and notifications are supported | The high learning curve, setting up |
| Encrypted cluster communication along with built-in distributed monitoring | Icinga from scratch can be a bit of a challenge starting out |
| Backward compatible with Nagios | |
| Scalability is excellent |
System requirement
| Operating Systems | Windows, Linux |
| Database | IDO database backend (MySQL or PostgreSQL) |
| Webserver | e.g. Apache or Nginx |
| PHP version | 5.6.0 |
| PHP modules | cURL, get text, intl, mbstring, OpenSSL and XML |
| PHP library | MySQL or PostgreSQL PHP libraries |
| LDAP PHP library | when using Active Directory or LDAP for authentication |
Official Video Intro Icinga Application
- Zabbix
- Nagios
- Spiceworks
- Datadog
- LibreNMS
- Pandora FMS
Icinga Application Overview

Technical Specification
| Version | 2 |
| File Size | 228 MB |
| Languages | Multiple |
| License | Free Trial |
| Developer | Icinga GmbH |
ad


Comments are closed.