[vc_row][vc_column][vc_tta_tabs style=”modern” active_section=”1″][vc_tta_section title=”About” tab_id=”aboutf856-8f34f7db-0b32″][vc_column_text]
Microsoft Power BI Desktop is a powerful data analytics and reporting tool designed as a companion desktop application for Microsoft’s Power BI service. It features interactive data visualization and data querying capabilities that work together to assist you in creating comprehensive, professional-looking reports that can be shared with business partners and customers.
If you use the Power BI service from Microsoft, then you should also use the analytical and reporting application called Microsoft Power BI Desktop 64 bit. Both tools can be used together on your desktop computer. Some of the features you’ll receive include data querying abilities and data visualization tools, which are interactive and help you produce professional, all-inclusive reports for sharing with customers and business associates. You can learn more about the immense ability that this tool possesses by opting for a Power BI training

With a look that resembles other Microsoft-signed apps in the Office suite, Power BI Desktop provides one-click access to the available data importing and visualization tools, alongside a generous multi-page workspace where elements and objects can be moved around using simple drag and drop actions.
Several Sources for Importing Data
The tool is designed to look like other Microsoft Office applications. With just one click, you can access all the data importing tools and visualization tools that are available. Meanwhile, you’ll have a workspace with several pages to it. In the workspace, you can drag and drop different objects and elements.
The range of data sources Power BI Desktop supports is more than enough to meet the requirements of the most demanding users, covering Excel workbooks, CSV, XML or text documents, simple folders, databases like SQL Server, Access, Oracle, IBM DB2, MySQL, PostgreSQL, Sybase, Microsoft Azure, Sharepoint, Active Directory, Microsoft Exchange, Hadoop, Google Analytics, Salesforce, Github, cloud services, and the list does not end here, as you can also enter data manually by creating new tables. In other words, Power BI Desktop is extremely versatile when it comes to connecting to your data.

Produce Powerful Visual Representations
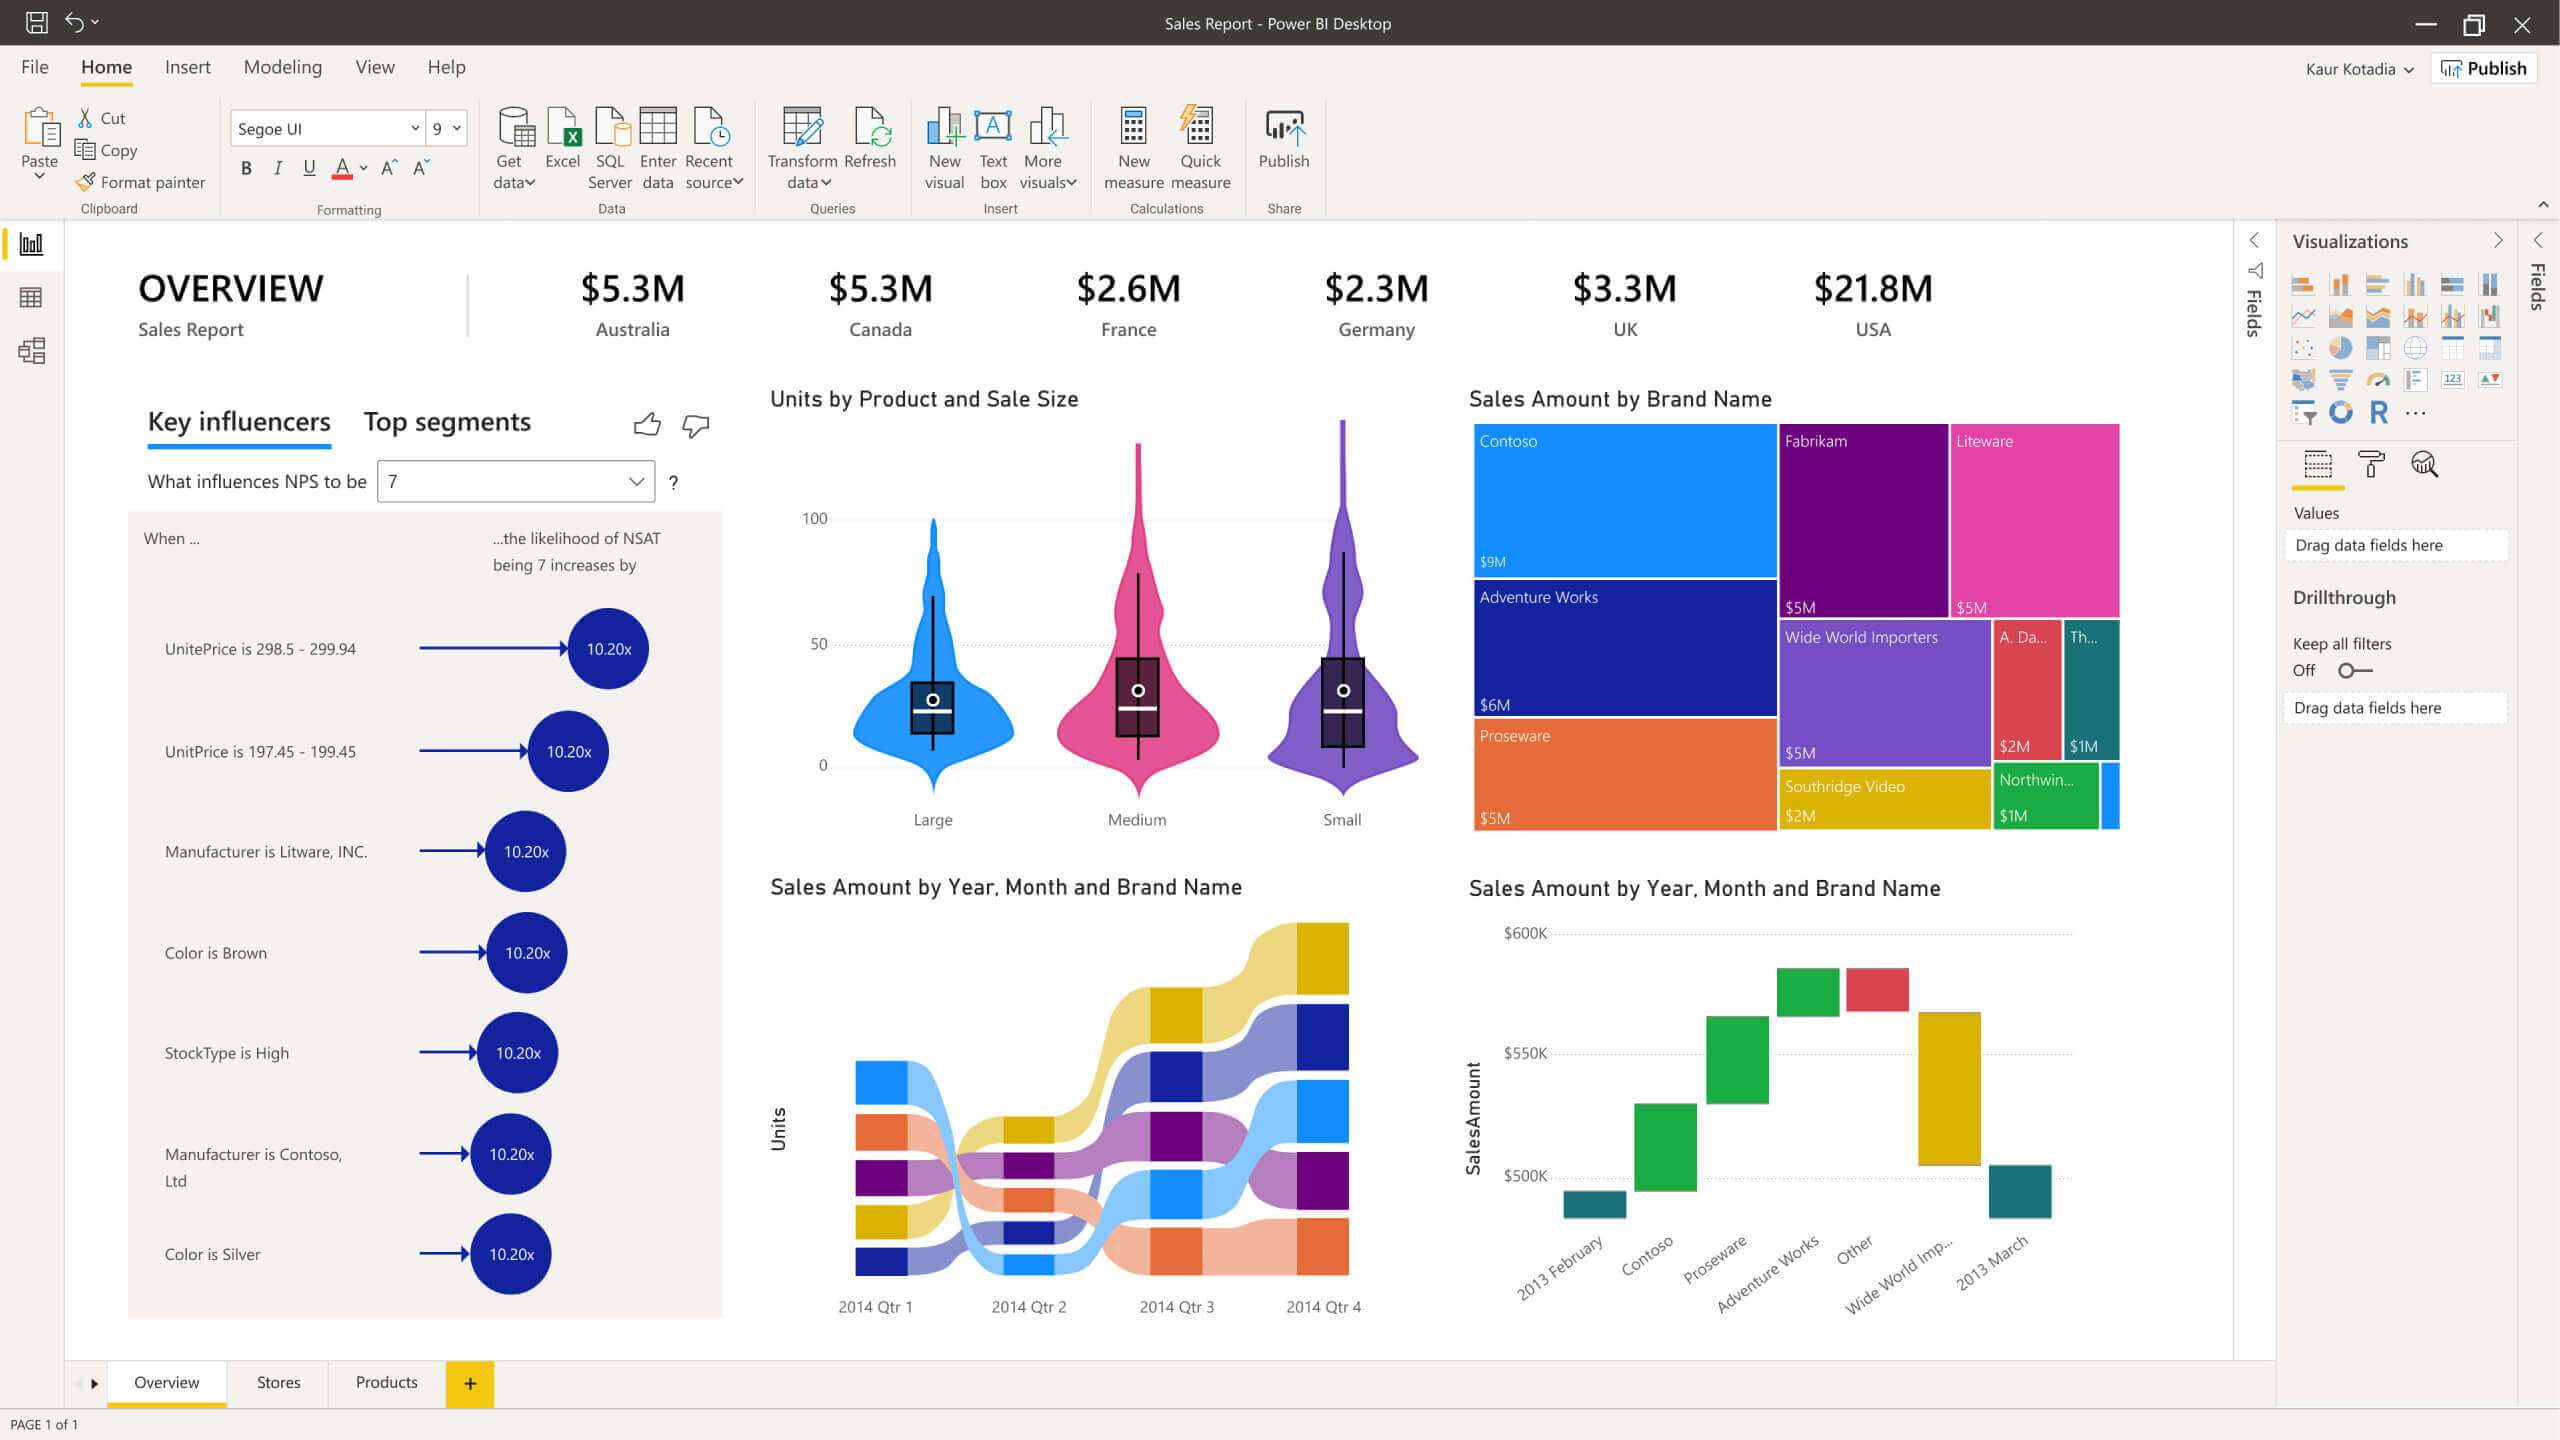
Microsoft Power BI Desktop is an advanced reporting tool that lets you produce visual representations based on complicated data. That way, a layperson can understand the data more easily than if it were simply raw table data. The visuals include an array of charts and graphs, gauges, maps, and cards. In addition, the tool lets you import extra customized data visualization software free.
You can access various chart elements with one click, such as colors, legend, axis data, filters, values, labels, reference lines, and many other things. The report can be customized in a variety of different ways. You’ll have the option to select the fields that go in the chart and the fields you want to ignore. You’ll be able to enhance your pages by adding shapes, text boxes, and images. Data sets are like database tables because they let you organize field relationships.

Strong Reporting Tool Designed for Business Users
Power BI for Desktop has an interface with a modernized design and easily accessible options. It is an advanced reporting tool which can manage huge amounts of data sets from a variety of sources. It can combine these data sets together into one all-inclusive report and then share it on the software’s platform. You cannot save reports in any other type of format. If you have the desktop edition, you won’t need to sign into your business account with Microsoft Power BI app. The only time you must sign in is when you want to publish your reports.

Designed as an advanced reporting tool, Power BI Desktop enables you to generate visual representations of complex data, which are much more easy to understand compared to raw tables. It comprises an assortment of graph and chart types, including maps, cards, and gauges. And if that is not enough, you can import additional custom visualizations.
Power BI Desktop provides one-click access to chart elements (axis data, legend, colors, values, filters, reference lines, labels, and so on), allowing full customization of the resulting report. You can choose which fields to include in a chart and which to ignore, and enrich your pages with text boxes, images or shapes. Data sets are in a similar way to database tables which allows you to configure relationships between fields.
Microsoft Power BI Desktop offers an advanced reporting tool that can handle large data sets from various sources, combining them into a single comprehensive report that can be shared via the Power BI platform or exported to Pyramid Server. Unfortunately, reports cannot be saved in any other format. The desktop edition does not require signing in to a business Power BI account unless the user intends to publish the generated reports.
Pros And Cons of Power BI Desktop
| Pros | Cons |
| Familiar, Excel-Like Interface | Doesn’t Handle Large Datasets Well |
| Lets You Access Data from On-Premise and Cloud-Based Sources | Does Not Allow for Granularity |
| Cuts Down Your Data Prep Time with Data Modeling Tools | Some Features Can Be Overwhelming |
| Creates Stunning Visualizations and Reports | Users Need to Be Familiar with Excel to Use the App with Ease |
System Requirements of Microsoft Power BI Desktop
| Processor | 1 gigahertz (GHz) or faster x86- or x64-bit processor recommended. |
| Memory | At least 1 GB available, 1.5 GB or more recommended. |
| Display Resolution | At least 1440×900 or 1600×900 (16:9) recommended. Lower resolutions such as 1024×768 or 1280×800 are not recommended, as certain controls (such as closing the startup screen) display beyond those resolutions. |
| Database Engine | MICROSOFT ACCESS DATABASE ENGINE |
| Required credential | Office 365 user ID and password |
| Framework | .Net Framework 4.5 |
[/vc_column_text][/vc_tta_section][vc_tta_section title=”Screenshots” tab_id=”screenshotsf856-8f34f7db-0b32″][vc_column_text]
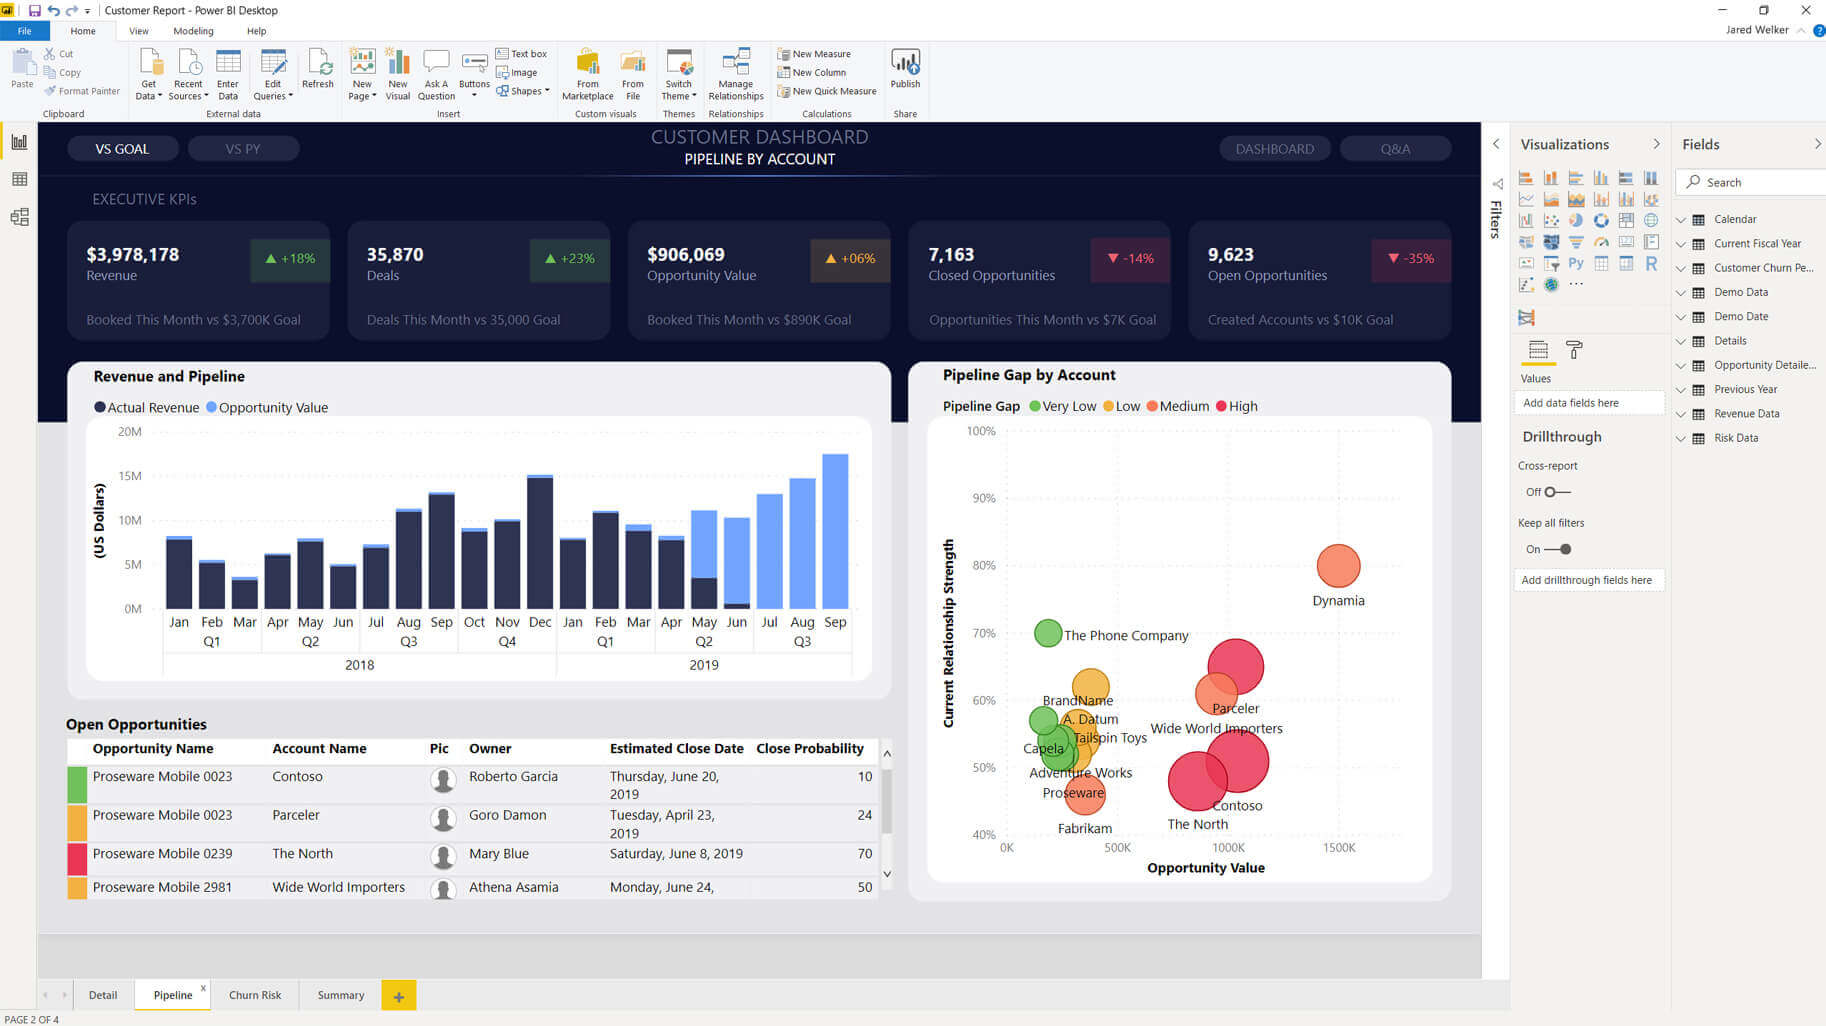
Screenshots of Power BI Desktop
[/vc_column_text][vc_gallery interval=”3″ images=”54869″ img_size=”575×471″ title=”Customer Dashboard Pipeline By Account”][/vc_tta_section][vc_tta_section title=”Video” tab_id=”videof856-8f34f7db-0b32″][vc_column_text]
Official Video Intro Power BI Desktop
[/vc_column_text][vc_video link=”https://www.youtube.com/watch?v=WosoIBDuU-I” align=”center” title=”Power BI Update – May 2021″][/vc_tta_section][vc_tta_section title=”FAQs” tab_id=”faqsf856-8f34f7db-0b32″][vc_column_text]
Power BI Desktop FAQs
[/vc_column_text][vc_toggle title=”What is the Microsoft Power BI service?”]
The Power BI service is a cloud-based business analytics service that enables anyone to visualize and analyze data with greater speed, efficiency, and understanding. It connects users to a broad range of cloud-based and on-premises data through easy-to-use dashboards, interactive reports, and compelling visualizations that bring data to life.
[/vc_toggle][vc_toggle title=”What is a Power BI ‘business user’?”]
The way you interact with Power BI will depend on your job role. As an end user or business user, you are the person who receives content (dashboards, reports, and apps) from colleagues. You work in the online or mobile version of Power BI, which is called the Power BI service, reviewing and interacting with this content, to make business decisions.
[/vc_toggle][vc_toggle title=”What’s the difference between Power BI Pro and Power BI Premium?”]Power BI Pro is an individual user license that allows access to all content and capabilities in the Power BI service. You can even share content and collaborate with other Pro users. Only Pro users can publish content to other workspaces, share dashboards, and subscribe to dashboards and reports.
Power BI Premium provides a capacity to deliver more consistent performance. It also supports larger data volumes in Power BI. For individual users, Premium enables widespread distribution of content by Pro users and it doesn’t require per-user Pro licenses for recipients viewing the content. This means that business users can collaborate with colleagues and view and interact with dashboards, reports, and apps that have been shared with them.[/vc_toggle][vc_toggle title=”What is Power BI Desktop?”]Power BI Desktop is a free application you can install right on your own computer. Power BI Desktop works cohesively with the Power BI service. Data scientists, report designers, admins, and developers work with Power BI Desktop to produce reports and make them available to the Power BI service business users, like you.[/vc_toggle][vc_toggle title=”Why do I have to sign up with my work email?”]Power BI doesn’t support email addresses provided by consumer email services or telecommunications providers.[/vc_toggle][/vc_tta_section][vc_tta_section title=”Old Versions” tab_id=”older-versionsf856-8f34f7db-0b32″][vc_column_text]
Power BI Desktop Older Versions
[/vc_column_text][vc_column_text]
| Version Name | Date | Size | Download |
| PBIDesktopSetup_x64.exe | 20 May,2021 | 350 MB | Download |
[/vc_column_text][/vc_tta_section][vc_tta_section title=”Alternatives” tab_id=”1613204936455-cd1a2326-6b56f856-8f34f7db-0b32″][vc_column_text]
- Metabase
- Tableau
- JetPack Data
- Talend
- Pentaho
- Google Data Studio
- QlikView
- JasperReports
- LinceBI
- SpagoBI
[/vc_column_text][/vc_tta_section][/vc_tta_tabs][/vc_column][/vc_row][vc_row][vc_column][vc_column_text]
Power BI Desktop Overview
[/vc_column_text][vc_single_image image=”54873″][vc_column_text css=”.vc_custom_1622118180119{margin-top: 10px !important;}”]
Technical Specification
| Software Name | Power BI Desktop Software For Windows V 2.93.641.0 |
| File Size | 351 MB |
| Languages | English, Italian, French, Spanish, Polish, Chinese, German, Japanese |
| License | Free Trial |
| Developer | Microsoft Corporation |
[/vc_column_text][/vc_column][/vc_row][vc_row][vc_column][vc_column_text]Conclusion
With Power BI Desktop, collating company data and identifying trends can be a breeze. It even helps you create reports and visuals for your company to better and easily understand how your organization stands. If you are looking for a BI solution that can meet your needs, this one is recommended.
[/vc_column_text][/vc_column][/vc_row]


